AI-Powered Dashboards: The Future of Business Intelligence
A traditional dashboard tells you sales dropped 12%. It does not tell you why, or what to do next. AI-powered dashboards close that gap with plain-English questions, automatic visualizations, and explanations, but only if your data is ready. Here is the technology stack behind them, where they are already delivering savings, and the questions to ask before picking a partner.

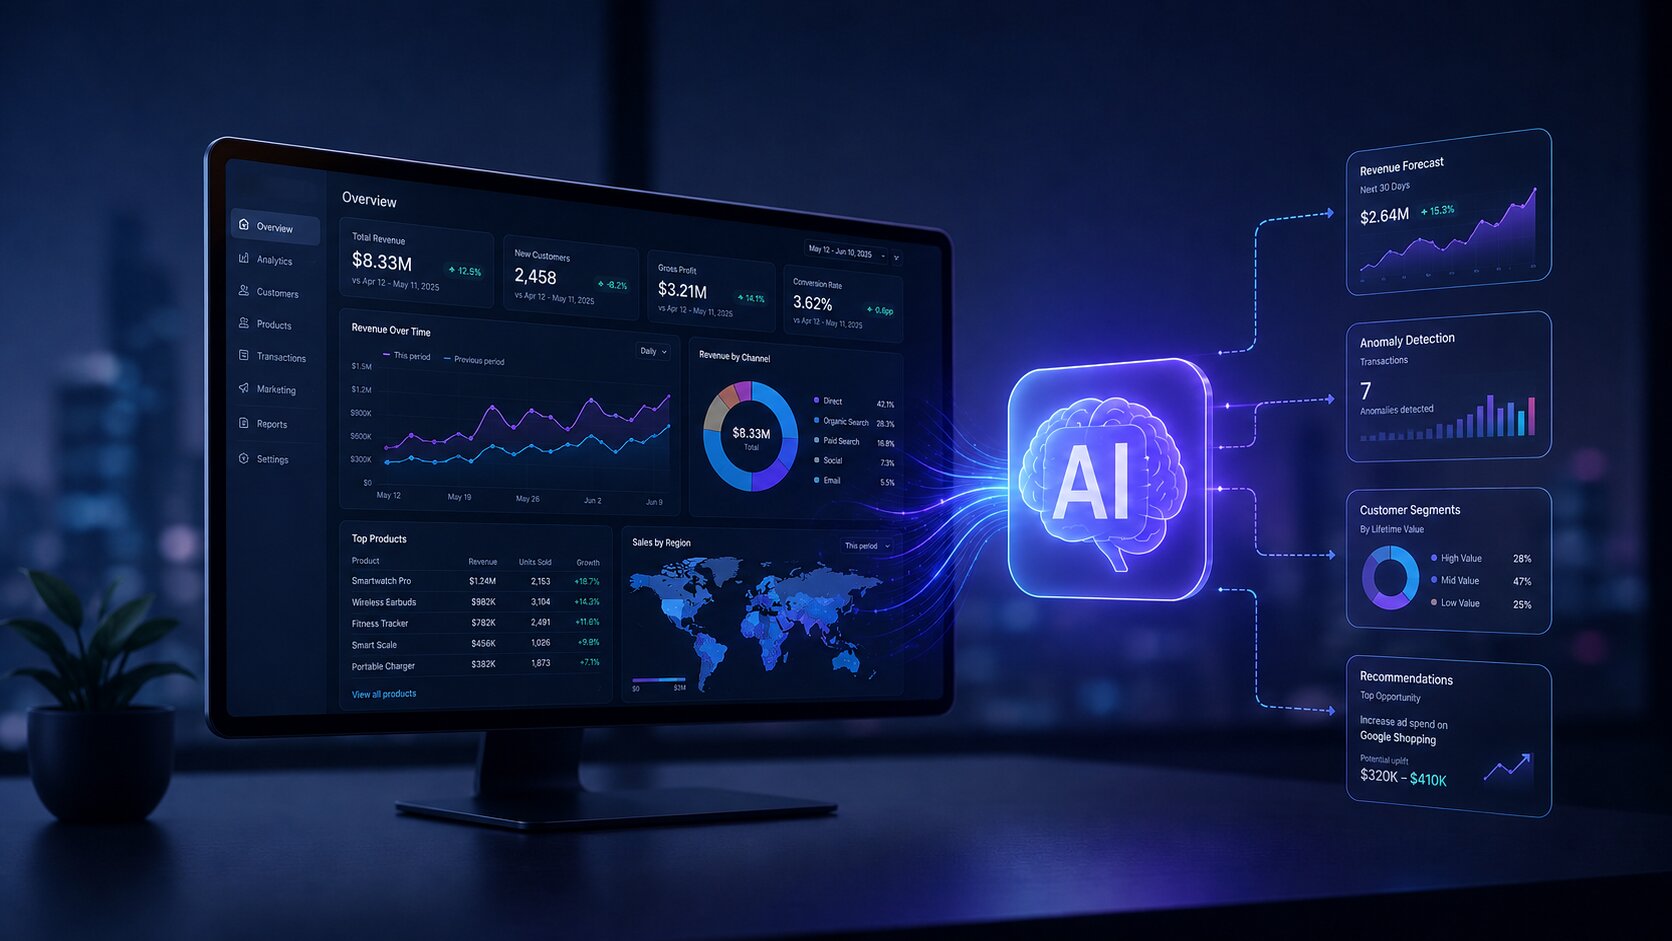
Your dashboard tells you sales dropped 12% last quarter. It doesn’t tell you why, and it definitely doesn’t tell you what to do next. That gap between “here’s the number” and “here’s the decision” is exactly what AI-powered dashboards are built to close. Instead of waiting days for an analyst to build a custom report, you ask a question in plain English and get an answer, a chart, and a reason, all in seconds.
Here’s what’s actually changed, what’s still hype, and how to tell the difference before you commit a budget to it.
Key Takeaways
- AI dashboards don’t just display data. They explain it, forecast it, and let you ask follow-up questions in plain English.
- Only 4% of IT leaders consider their data “AI-ready,” according to Gartner, so AI dashboard success starts with clean data, not fancy models.
- Text-to-SQL engines like Snowflake’s Cortex Analyst now hit close to 90% accuracy, closing the gap between “cool demo” and “trustworthy tool.”
What Is a Business Intelligence Dashboard, Really?
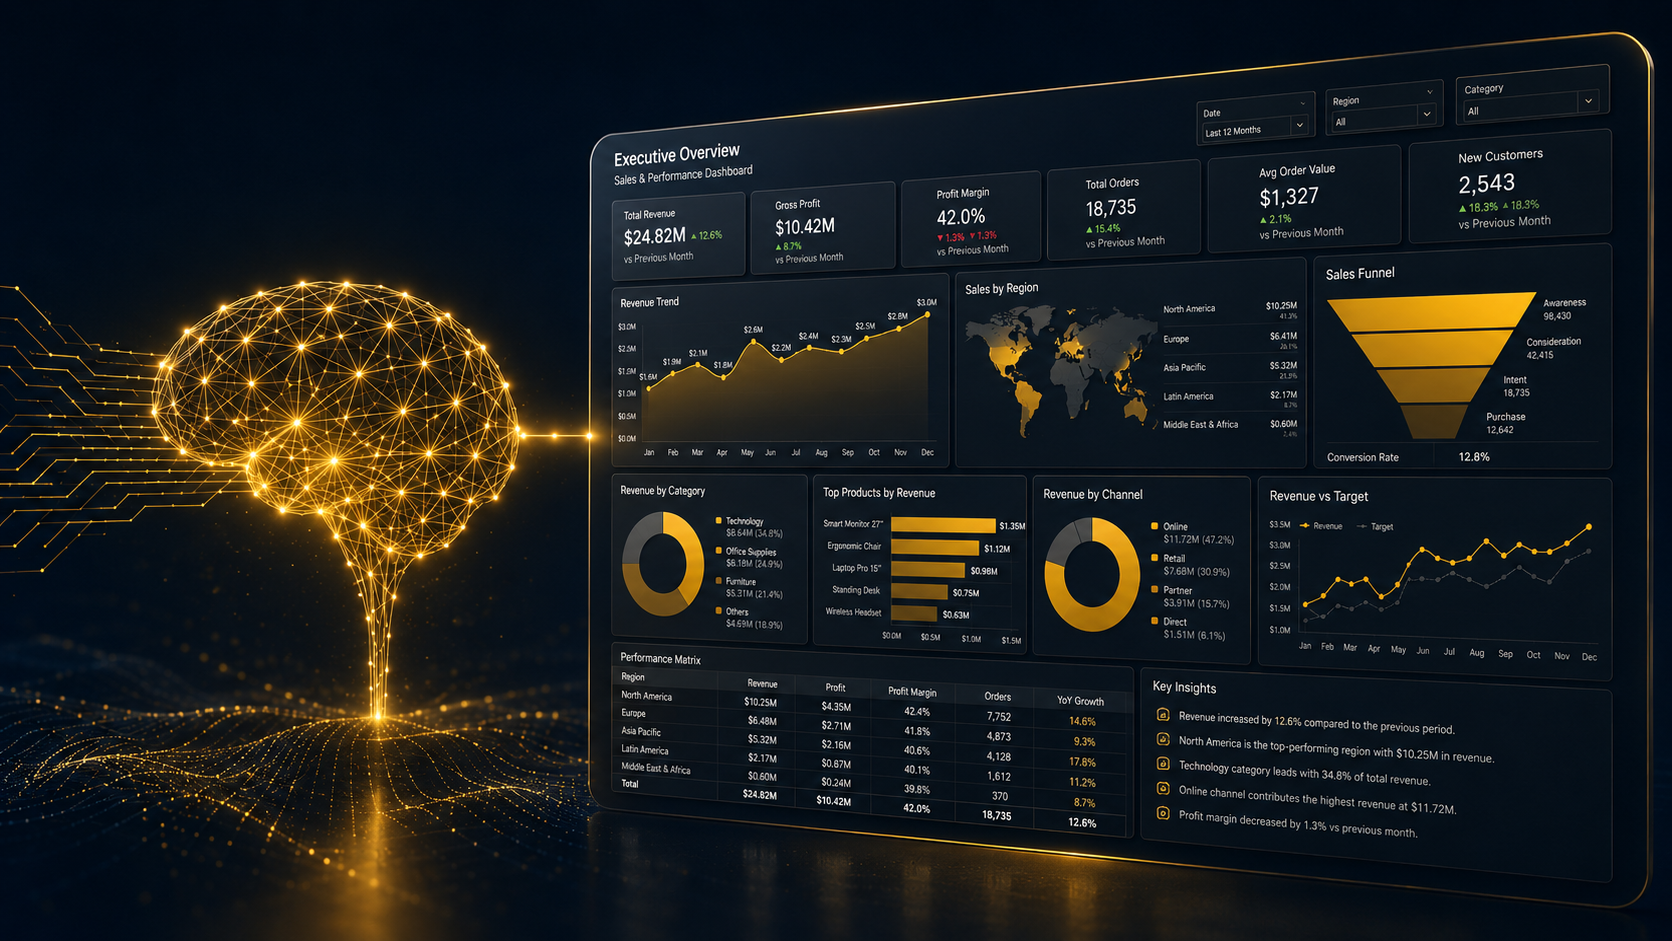
Before we jump into the AI layer, let’s ground the basics. A business intelligence dashboard is a visual workspace with charts, KPIs, and tables that pull data from your systems into one screen so you can track performance without digging through spreadsheets. Traditional BI platforms have done this for two decades. You picked your metrics, someone built the report, and you waited for updates.
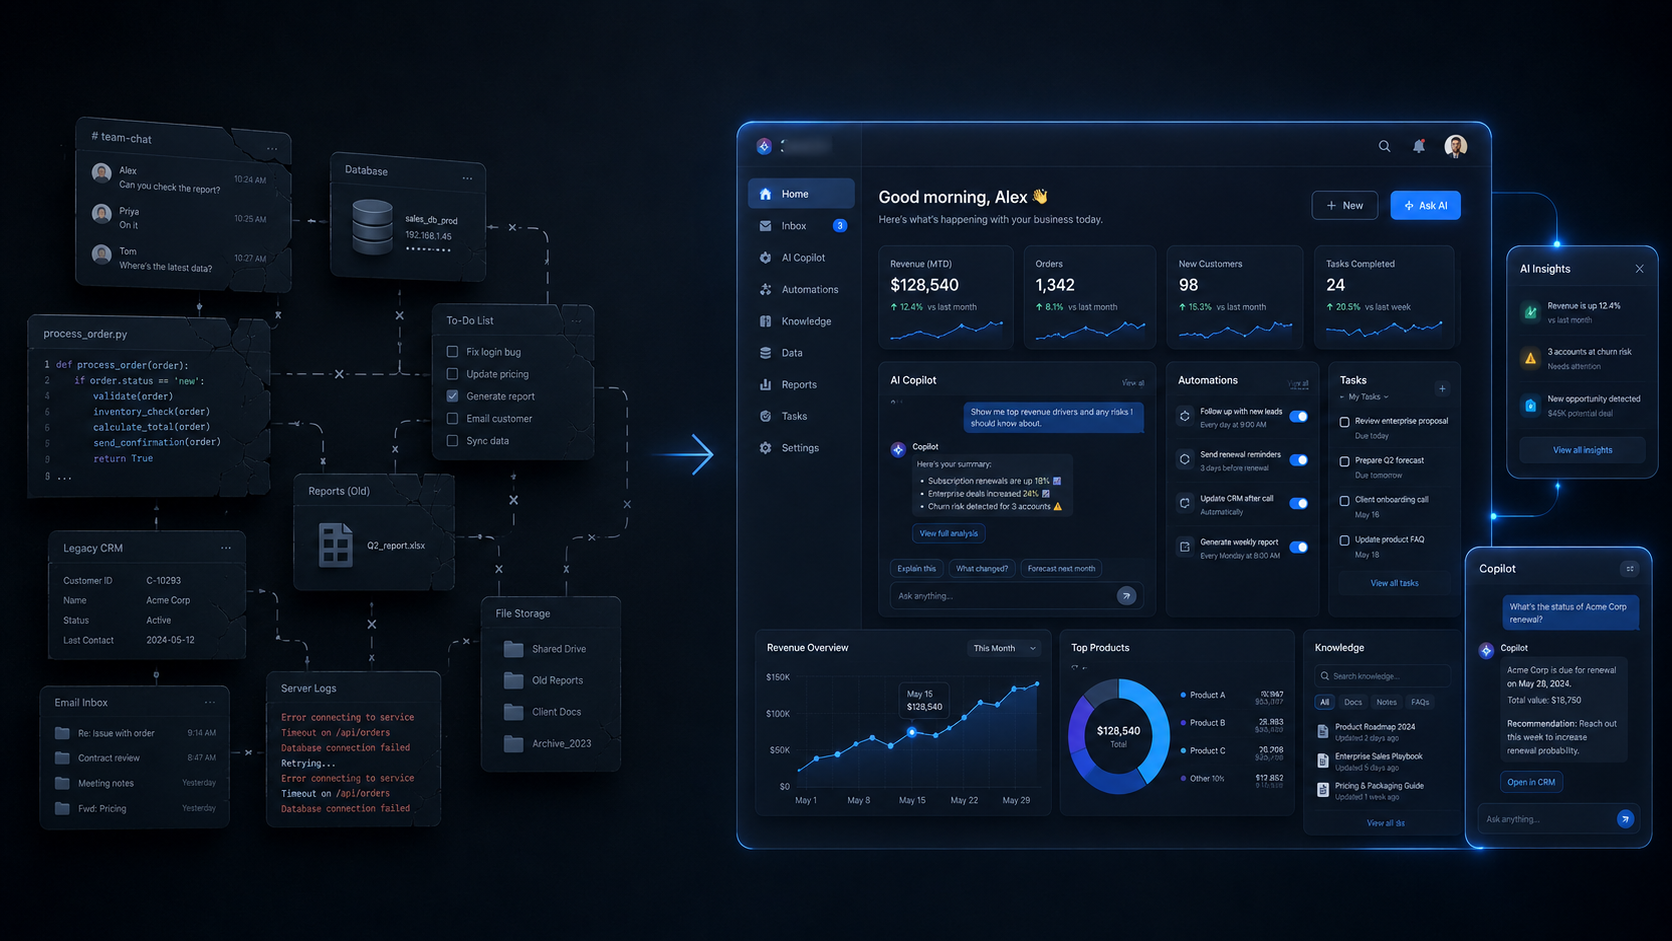
The problem? That model was built for a world where data moved slowly, and questions were predictable. Neither is true anymore. Your data volumes have exploded, and your team’s questions change daily, not quarterly.
This is exactly the gap AI dashboarding is built to close.
What Makes a Dashboard “AI-Powered”?
An AI dashboard is a fundamentally different way of interacting with data.
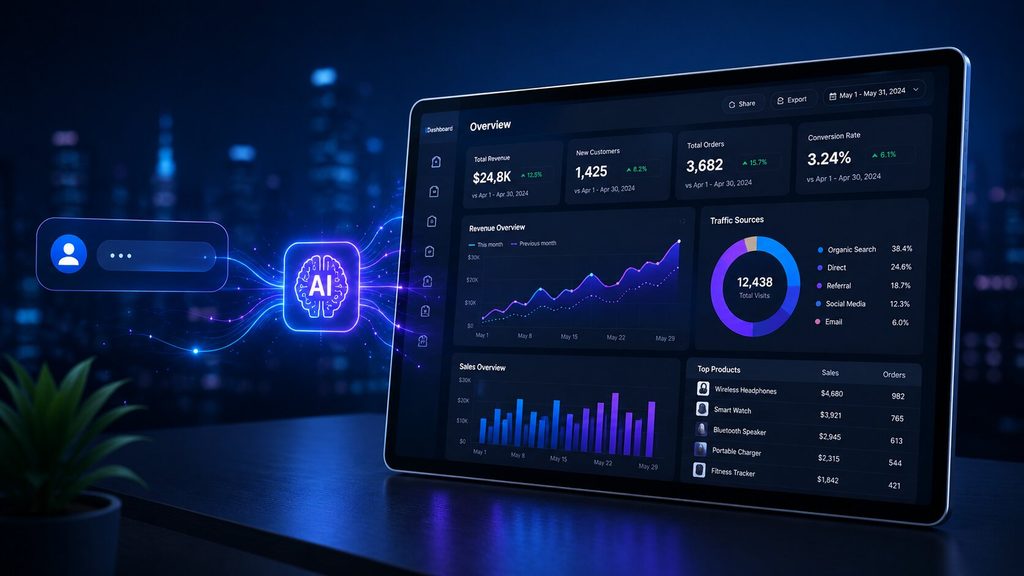
Instead of clicking through filters, you ask a question — “show me sales trends by region this quarter” — and the system does three things a static dashboard never could:
- Understands intent, not just keywords, using natural language processing (NLP)
- Generates the right visualization automatically, choosing a line chart for trends or a comparison card for two values
- Explains what’s happening, not just what the numbers say
Databricks frames this shift well: their AI/BI approach uses a compound AI system that learns and shares insights from data interactions across a company.
At VectovateAI, this is the same philosophy behind our Data Visualization & Dashboards work: dashboards that explain themselves, not just display numbers.
The Technology Stack Behind AI Dashboards
If you’re evaluating an AI dashboard generator, it helps to know what’s actually running under the hood. Four technologies do the heavy lifting:
| Technology | What It Does | Why It Matters |
|---|---|---|
| Text-to-SQL / NLP | Converts plain-English questions into database queries | Removes the SQL bottleneck for non-technical users |
| Machine Learning Models | Detects patterns, anomalies, and churn signals | Surfaces issues before a human would spot them |
| Predictive Analytics Engines | Forecasts trends using historical data | Shifts BI from “what happened” to “what’s next” |
| Automated Visualization Engines | Picks the right chart type instantly | Saves hours of manual dashboard design |
Snowflake’s Cortex Analyst reports it delivers self-serve answers from tables like sales transactions without writing SQL, with industry-leading accuracy of roughly 90%, which is the difference between a tool people trust and one they double-check every time.
This kind of accuracy depends entirely on the data engineering and data warehousing foundation underneath it. Skip that groundwork, and even the best AI model will produce shaky answers.

Why “Excel Dashboards AI” Searches Are Spiking
Excel dashboards AI tools have become such a popular entry point. You don’t need to rip out your existing systems. Modern AI layers can sit on top of Excel or your existing data warehouse and add:
- Natural language query boxes (“what were my top 5 products last month?”)
- Auto-generated pivot summaries and forecasts
- Anomaly flags on rows that look off compared to historical patterns
This is a low-risk way to test AI dashboard design before committing to a full platform migration, and it’s often the first place SMBs in India and the UAE start their AI journey through a lightweight data analytics engagement.
Real Business Impact: It’s Not Just Hype
Care-coordination platform Wellthy used natural language search to let its care team explore patient data without relying on data engineers, and the result was savings of more than $200,000 by increasing analyst efficiency.
That said, adoption is still uneven. A recent ThoughtSpot industry survey found 65% of organizations are either actively using or exploring AI solutions for data analytics, which tells you two things: the shift is real, but a third of the market hasn’t moved yet, which is your window to get ahead of competitors. Our own supply chain AI orchestration case study shows a similar pattern: a 60% reduction in operational costs once predictive analytics replaced manual reporting.
The Trust Problem Nobody Talks About Enough
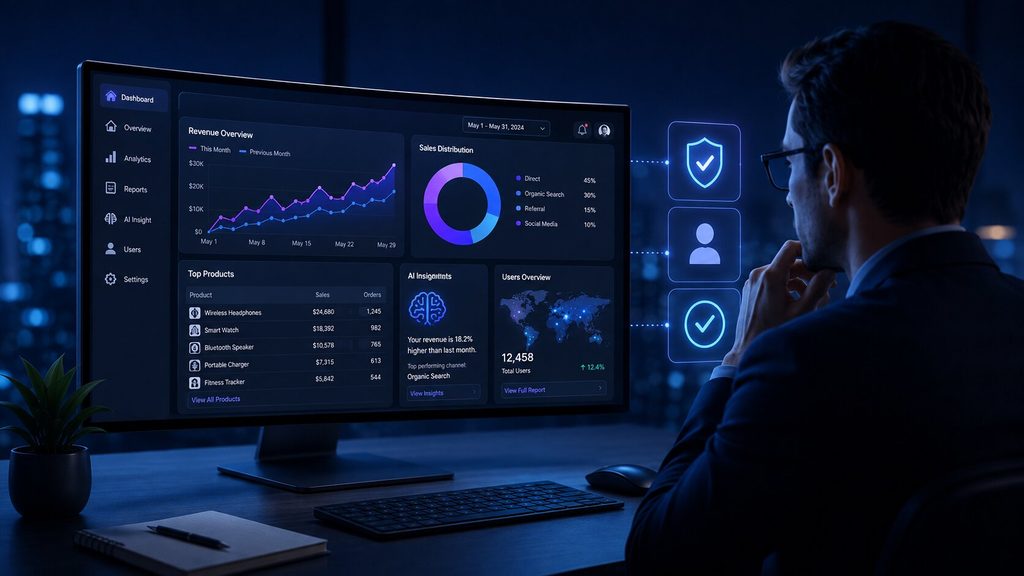
AI-powered dashboards are only as good as the data feeding them, and most companies aren’t ready. Gartner’s research is blunt on this: only 4% of IT leaders consider their data AI-ready. Feed a model messy, inconsistent, or duplicated data, and you don’t get insight, you get confident-sounding nonsense.
Gartner reports 50% of consumers don’t trust humans to use AI responsibly, which means transparency isn’t optional, it’s a competitive differentiator. If your dashboard AI can’t explain why it flagged a trend, adoption stalls no matter how accurate the model actually is.
This is why the strongest platforms build in human-in-the-loop review rather than fully autonomous decision-making. It’s also the core principle behind how we approach AI/ML development at VectovateAI: senior oversight on every model, not just automated output.
What Does “AI-Ready Data” Actually Look Like?
Before connecting an AI query engine or dashboard generator to your database, your data infrastructure must meet three engineering criteria:
- Unified Semantic Definitions: A single source of truth ensuring metric calculations (e.g., “Net Revenue” or “Active User”) mean the exact same thing across all departments.
- Context-Rich Schema Metadata: High-quality table documentation, foreign key constraints, and clear column naming so LLMs don’t misinterpret database logic.
- Automated Pipeline Hygiene: Real-time ingestion pipelines that continuously validate, clean, and deduplicate records before feeding analytics models.
Business Intelligence Dashboard Examples: Where AI Is Already Working
AI-driven dashboards are already delivering measurable results across industries:
- Retail: Forecasting inventory needs based on seasonal demand shifts, cutting both overstock and stockouts. See our work in retail & eCommerce.
- Healthcare: Flagging high-risk patients before discharge using treatment history and demographic patterns, reducing avoidable readmissions. More in healthcare AI.
- Finance: Scanning transactions in real time to catch fraud and unusual spending patterns before they escalate, a core use case in finance & insurance.
- Supply Chain: Detecting anomalies like unexpected price hikes or demand spikes across supplier networks, covered under supply chain & logistics.
- Marketing: Auto-segmenting customers and predicting campaign performance without waiting on an analyst.
What Is a Business Intelligence Dashboard Going to Look Like in 2027?
If you’re wondering what a business intelligence dashboard is going to evolve into next, the direction is fairly clear from where the major platforms are investing. Expect:
- Conversational-first interfaces replacing click-heavy filters almost entirely
- Proactive alerts where the dashboard tells you something’s wrong before you ask
- Role-based storytelling: executives get a summary, analysts get the granular breakdown, automatically
- Tighter governance layers as regulators start paying closer attention to AI-driven business decisions
The businesses that win with this shift will keep a human checkpoint on high-stakes decisions, even as the routine reporting gets fully automated, an approach we build into every AI agent development engagement.
How to Choose the Right AI Dashboard Partner?
Not every AI dashboard vendor is solving the same problem. Before you commit, ask these questions:
- How is your data prepared today? If it’s inconsistent across systems, fix that first. No AI model fixes bad inputs.
- Do you need self-service for business users, or deeper predictive modeling for analysts? These require different tooling.
- Can the vendor explain its recommendations, or is it a black box? Transparency isn’t a nice-to-have, it’s what drives adoption.
- Does the platform support human review before automated actions? This matters more in regulated industries like finance and healthcare.
- What’s the actual implementation timeline? Be wary of promises of instant transformation. The real work is in data readiness, not the AI layer itself.
If you’d rather talk this through than guess, our AI strategy & consulting team can map your current data setup against what an AI dashboard rollout would actually take.
How to Transition from Static Reports to AI Dashboards
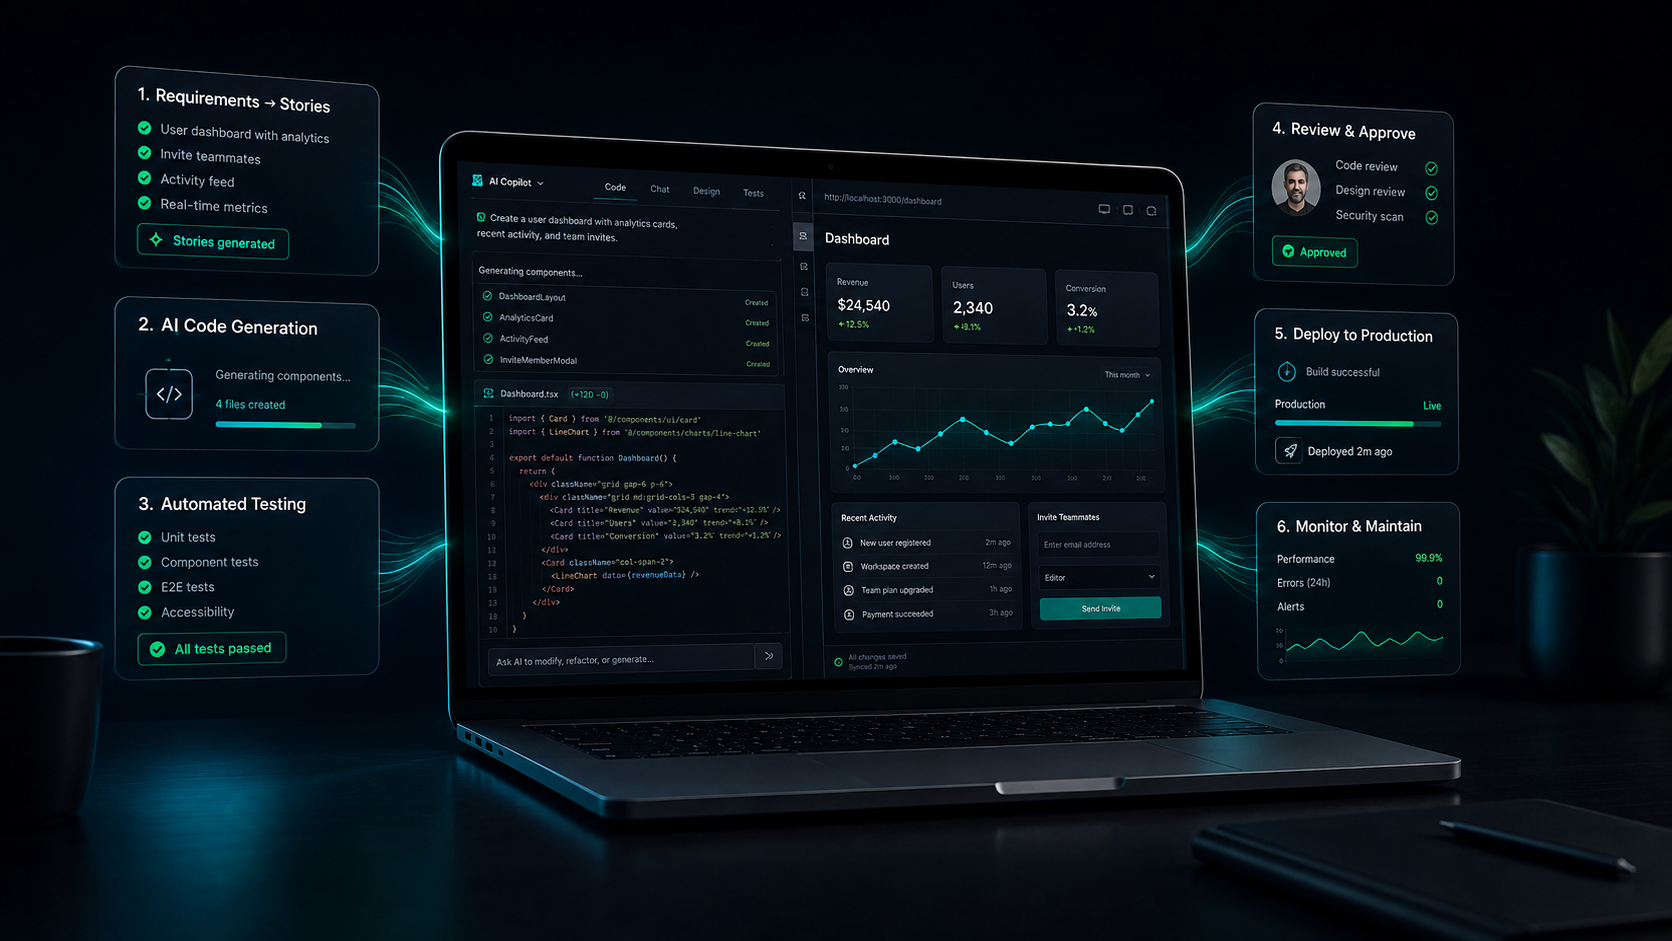
- Phase 1: Audit & Semantic Standardization: Clean legacy data schemas and define standardized metrics across your enterprise data warehouse.
- Phase 2: Hybrid AI Layer Deployment: Connect text-to-SQL engines (like Snowflake Cortex or custom MCP architecture) alongside existing Power BI/Tableau environments.
- Phase 3: Governance & Human-in-the-Loop Rollout: Deploy natural language queries with built-in validation checks so business leaders get instant answers with zero hallucination risk.
Final Thoughts
The shift toward AI dashboarding is about getting faster access to better-explained answers. Text-to-SQL accuracy is climbing, natural language interfaces are genuinely usable, and real companies are posting real savings.
The businesses winning today are the ones that treat data readiness as seriously as the AI model, keeping a human in the loop for decisions that actually matter.
Ready to see what an AI-powered dashboard would look like for your business? Talk to our AI architects.
Frequently Asked Questions.
Get all your answers here and if something remains ask our AI concierge or Book a call with our consultant.