All servicesData Visualization & Dashboards

Custom Data Visualization Development & Consulting Services for Enterprise Applications

VectovateAI engineers high-performance, real-time dashboards and intelligent visual front-ends that integrate directly into your core enterprise applications and data pipelines.

  • HIPAA · GDPR · SOC 2 Ready
  • 100% IP & Source Code Ownership
  • 17+ Years of Global Delivery Expertise
  • End-to-End Production Delivery
Our Services

Our Production-Grade Data Visualization Consulting Services

As an elite AI-Native software development company, we deliver end-to-end production code—from pipeline orchestration and semantic modeling to custom front-end deployment.

01

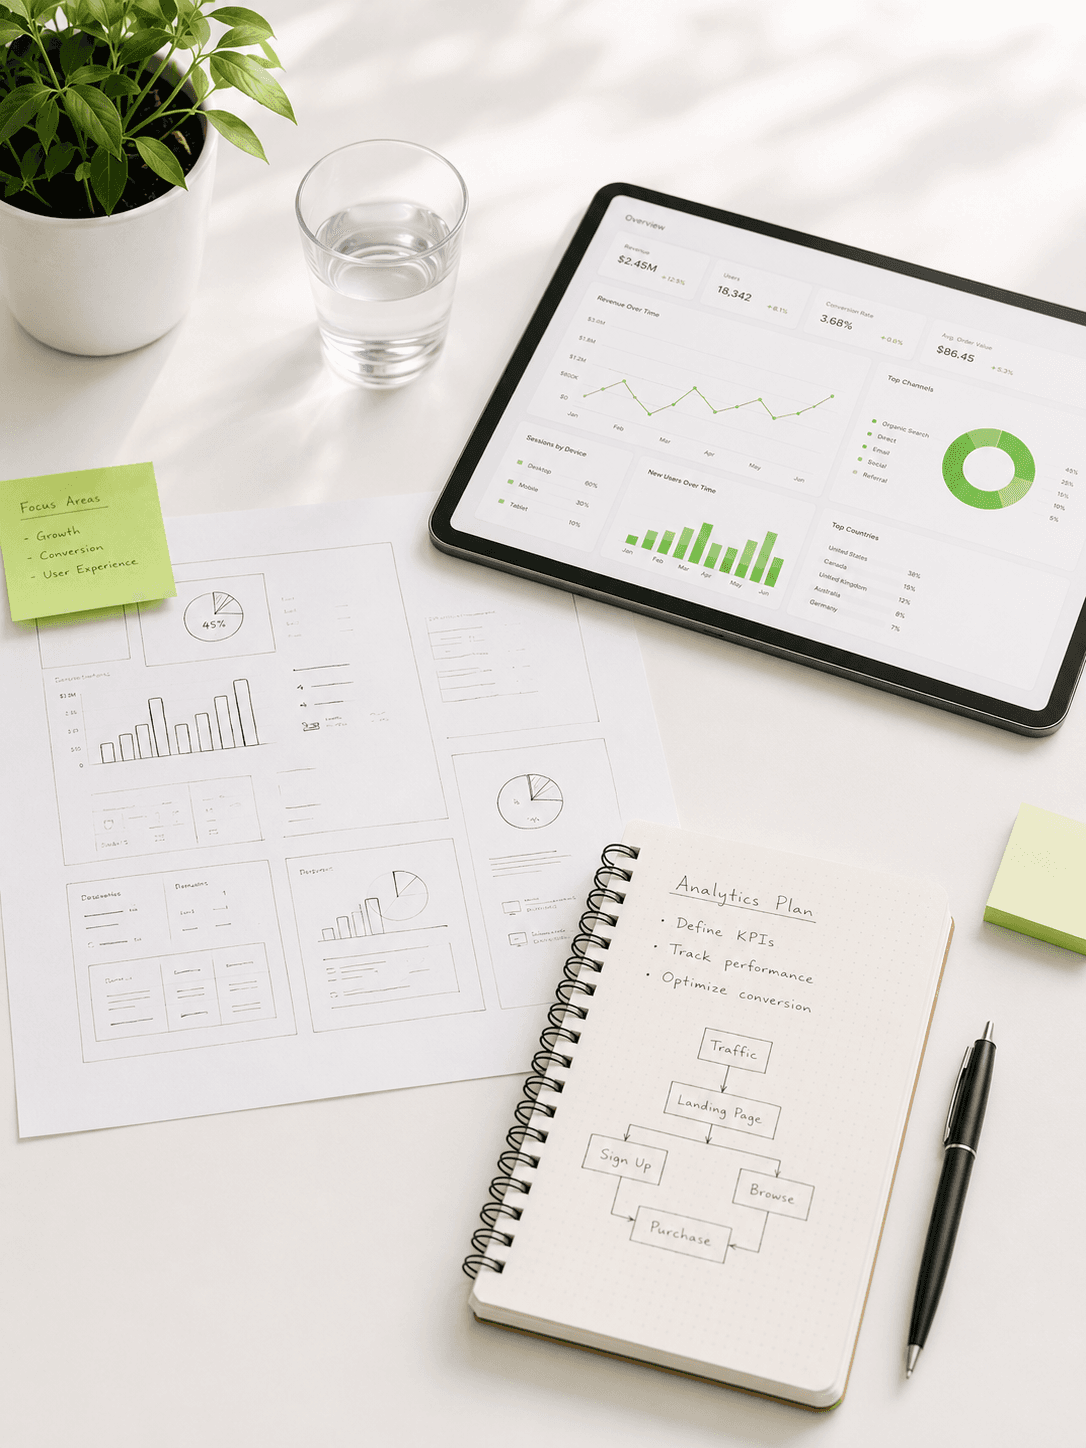
Visual Strategy & Roadmap Development

We identify your highest-impact visualization opportunities, prioritize ROI, and migrate slow legacy reports into lightning-fast, modern cloud environments built for real-time scale.

  • BI Modernization Services
  • KPI discovery & visualization use case mapping
  • Dashboard tool assessment & stack selection
  • Budget, timeline & resource alignment
02

Data Pipeline Engineering & Semantic Modeling

We build a single source of truth across your infrastructure, designing the preprocessing architecture so metrics mean the exact same thing everywhere.

  • Semantic Layer Consulting and Analytics Engineering
  • Data quality and availability assessment
  • ETL/ELT pipeline construction & gap remediation
  • Semantic layer modeling (dbt) for unified business logic
03

Dashboard Architecture & Design Consulting

We balance clarity, speed, interactivity, and cost for every user level, using NLP and smart summaries so executives get instant answers from their data.

  • AI-Assisted Reporting Systems
  • Chart type and layout selection strategy
  • Dashboard wireframing & UX design planning
  • Prototype and MVP scope definition
04

Automated Data Ingestion & BI Platform Integration

We keep reporting systems accurate and current through automated refresh cycles, governance frameworks, and live database connections that eliminate manual Excel exports entirely.

  • End-to-End Dashboard Automation
  • BI tool selection & integration architecture
  • Automated reporting pipeline design
  • Report scheduling, refresh & delivery strategy
05

Dashboard Audit & Performance Optimization

We audit your dashboards, identify bottlenecks, and deliver a remediation plan, supercharging them with predictive models, forecasting layers, and automated anomaly detection.

  • AI-Enabled Power BI & Tableau Consulting
  • Existing dashboard performance benchmarking
  • Root cause analysis of data misrepresentation
  • Visual redesign and layout optimization
06

Compliance & Governance for Visual Data Systems

We construct secure, production-grade data foundations meeting HIPAA, GDPR, SOC 2, and governance standards via standardized Model Context Protocol integrations.

  • MCP-Enabled Analytics Architecture
  • HIPAA, GDPR, SOC 2 compliance design review
  • Data access control and permission architecture
  • Audit trail and data lineage documentation
What Sets Us Apart

Advanced Intelligence Layers We Embed Into Your Visual Strategy

We integrate intelligence capabilities into every data visualization consulting engagement. Your dashboards become adaptive, predictive, and commercially impactful over time.

Predictive Trend Overlays

We advise on embedding ML-powered trend layers into dashboards that forecast outcomes, not just report history.

AI-Driven Anomaly Detection Visuals

We design alert-ready visualization architectures that surface unexpected data shifts before they become business problems.

Natural Language Query Integration

We deploy custom GenAI LLM wrappers and semantic parsers so your business users ask plain-English questions and receive instant visual answers.

Real-Time Streaming Dashboards

We architect live-data visualization systems using WebSockets and real-time event streaming built for fraud monitoring, operational control rooms, and time-critical decisions.

Geospatial & Map-Based Intelligence

We consult on geographic data visualization deployments that map customer behavior, logistics flow, and regional performance.

Live capabilities

Live hands-on to
our AI capabilities.

AI Concierge Live

Ask anything.
Answered in seconds.

Do you support HIPAA-compliant deployments?
Yes — we architect to HIPAA, GDPR, and SOC2. Want a sample case study from our healthcare work?
Ask the Concierge
ROI Calculator~60s

Get a real budget
in 60 seconds.

Project typeAI Agent Platform
Team replaced4 engineers
Annual savings~$640K / yr
Calculate my ROI
Business challenges

Real Visualization Problems. Practical Engineering Solutions.

As a data visualization consulting firm, we step in where technical complexity meets business risk and deliver clear, executable solutions.

The Challenge

No Unified Dashboard Strategy Across Teams

AI-Native Solution

Centralized Semantic Layers & Unified Looker/Power BI Templates

We run structured discovery workshops to identify which dashboards deliver the fastest clarity and build a phased rollout aligned to your business goals.

The Challenge

Dashboards Built Without User Context

AI-Native Solution

Role-Based Dashboard Redesign

We audit your current visuals, identify who uses what and why, and redesign your dashboards around actual user decision workflows.

The Challenge

Data That Refreshes Too Slowly or Breaks in Live Reports

AI-Native Solution

Automated Pipeline & Refresh Architecture

We redesign your data connections, implement reliable refresh schedules, and build resilient pipelines that power dashboards consistently.

The Challenge

Compliance Risks in Customer or Financial Data Dashboards

AI-Native Solution

Governance-Integrated Dashboard Design

We embed HIPAA, GDPR, and SOC 2 controls directly into your visualization architecture without compromising dashboard performance.

Facing similar data challenges in your business?

Talk to Our Lead Dashboard Engineer
How we work

Our Data Visualization Development & Consulting Process

We follow a structured, low-risk process that aligns visual execution with business objectives at every stage.

  1. 01

    Business Discovery & Data Mapping

    We conduct discovery workshops to map your business goals, identify your highest-value dashboard use cases, and assess your current data landscape and tool readiness.

  2. 02

    Data Architecture Design & Schema Blueprinting

    Our team evaluates your existing pipelines, quality standards, and infrastructure gaps. We map out the targeted data schema required to fuel the application.

  3. 03

    Interactive Wireframing & Prototyping

    We produce a detailed visual strategy document covering use case prioritization, recommended tool stack, dashboard architecture, and phased delivery milestones.

  4. 04

    Pipeline Integration & Backend Engineering

    We spin up the data aggregation layers, connect to your warehouses (Snowflake/Databricks), and build out the dbt semantic transformations.

  5. 05

    Front-End Coding & Visual Engineering

    Our engineering squads write the production-grade front-end dashboards using BI platforms or custom visualization web libraries like D3.js or Plotly.

  6. 06

    Deployment, Governance & Optimization Guidance

    Post-launch, we set up monitoring frameworks, define refresh triggers, and provide continuous optimization guidance to keep your dashboards accurate over time.

Struggling to scale your data visualization systems efficiently?

Talk to Our Data Visualization Experts
Technology Stack

The Data Visualization Technology Stack We Consult On

26tools across
5 stack layers

Reporting & visualization tools07 tools

  • Power BI
  • Tableau
  • Looker Studio
  • Grafana
  • Metabase
  • Domo
  • Redash
Industries We Serve

Data Visualization Consulting & Development Across Industries

We bring specialized expertise to sectors where visual intelligence delivers the greatest commercial and operational impact: finance, healthcare, retail, logistics, manufacturing, SaaS, and beyond.

Why Choose Us

Why Choose VectovateAI as Your Data Visualization Consultancy?

Partnering with an experienced data visualization consulting firm ensures your strategy is built on what actually works in production environments.

  • Visualization Strategy Grounded in Real Delivery

    We have built and deployed visual intelligence systems across industries. Every recommendation reflects real data conditions and real business pressure.

  • Senior Visualization Architects on Every Engagement

    You get direct access to senior consultants, not junior analysts. Our experts bring hands-on experience across dashboard design, data engineering, BI integration, and enterprise governance.

  • Risk Reduction at Every Stage

    We identify design and data risks early, before they become costly post-launch failures. Our structured feasibility assessments protect your investment from the start.

  • Compliance-First Dashboard Design

    We integrate HIPAA, GDPR, and SOC 2 requirements into every visualization architecture recommendation secure and compliant without sacrificing performance.

  • Transparent Engagement Models

    We offer Dedicated Data & AI Software Engineering Squads, Managed Product, Optimization Retainers, Time & Materials, and Fixed Price models designed to flex with your needs and budget.

Let's build it

Turn Your Data Into Decisions. Starting Today.

Get clear dashboard blueprints, honest feasibility assessments, and expert strategy.

Claim Your Free Visualization Strategy Session
Keep exploring

Related services.

More ways VectovateAI ships AI-native software across the stack.

FAQs

Frequently Asked Questions.

Still unsure about opting data visualization services?

Data visualization consulting focuses on strategy, architecture, and governance, defining what to build, how to build it, and which approach delivers sustainable results. Dashboard development executes that plan. VectovateAI offers both, allowing a seamless transition from strategy to production delivery.

Engagements vary by scope and complexity. A focused discovery and roadmap session typically starts from a defined fixed fee. Ongoing consulting retainers are scoped monthly based on deliverables. We provide transparent pricing estimates within 24 hours of your initial discovery session.

Evaluate firms by their industry experience, tech stack coverage, governance capabilities, and whether you get senior consultants or junior staff. VectovateAI provides direct access to senior architects on every engagement, with no hand-offs to junior teams mid-project.

Yes. We regularly conduct data visualization consulting audits for teams with cluttered, inaccurate, or slow dashboards. We identify root causes, benchmark performance, and deliver a prioritized remediation plan with clear improvement targets.

We operate under strict NDAs and implement private cloud configurations when handling sensitive data. All consulting deliverables comply with HIPAA, GDPR, and SOC 2 standards by default. Your proprietary data is never shared with third-party pipelines.

Let's get started

Get Your Data Visualization Strategy Defined
Clearly.

Stop guessing your dashboard roadmap. We deliver structured data visualisation consultancy that transforms raw data into production-grade visual intelligence fast.